![]()
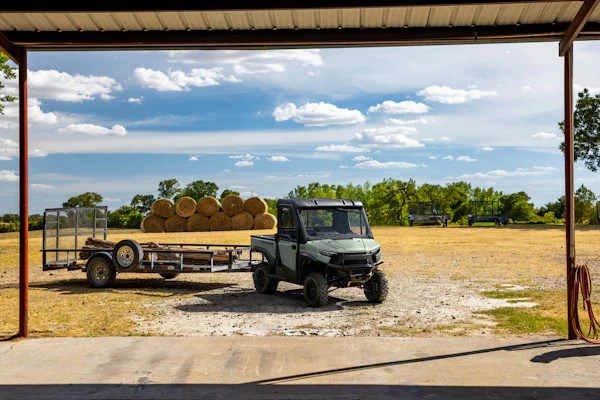
Fleetmatics’ software gathers information on vehicle location, speed and mileage, as well as quick acceleration, hard turns and the like.
When it comes to heavy-footed drivers in New Mexico, maybe it’s not landscape crews’ drivers but those in other industries that skewed the numbers – the electricians, roofers, HVAC and plumbing workers, among others. While Fleetmatics’ recent analysis of its 2015 data provides some landscaping-specific information, the principal metrics include those other service businesses, too.
Still, considering that the data on service trucks does not include tractor-trailer trucks, the numbers on New Mexico suggest that virtually all industries there that use Fleetmatics to help manage their service vehicles may want to have a heart-to-heart with their drivers about speed limits.
In a breakdown of “severe driving incidents” – a category that includes harsh acceleration, hard turns (cornering), harsh breaking and speeding (over 80 mph) – New Mexico was at the top of the list. But, here’s the thing: The issue among service truck drivers there had nothing to do with accelerating too fast, which they did 56 percent fewer times than the national average, hard turns (22 percent below the national average), or hard breaking (52 percent lower).
The one statistic that put New Mexico at the top of the list for severe driving incidents was speeding at more than 80 mph. On that criterion, the state’s service truck drivers (or at least those whose companies use Fleetmatics) were 359 percent above the national average.
States with the most severe driving incidents – after New Mexico, New Jersey and North Carolina – were (in descending order) Texas, Louisiana, Ohio, Missouri, Indiana, Wisconsin and West Virginia.
The top three states for recording the least severe driving incidents were North Dakota, Delaware and Alabama.
In some instances, the Fleetmatics analysis simply affirms what landscapers already know. For example, the 2015 data reflects the fact that landscape professionals in the South and West are able to stretch out the most productive months of the year due to the longer growing season.
Interestingly, landscapers’ total “stops” in service trucks in 2015 was down, if ever so slightly, from the year before – from 8.2 stops per day in 2014 to 7.99 last year.
Responding to questions via email, Fleetmatics’ director of product marketing, Todd Ewing, said weather could account for the slight decline.
Not surprisingly, the information on vehicle stops also reflects landscaping seasonality, with the green industry’s service vehicles “22 percent more productive” in the spring and summer.
Overall, service trucks in Fleetmatics’ “Lawn and Garden” category were the second most productive based on stops. “Pest Management” was No. 1 in productivity.
Landscaping service vehicles using Fleetmatics drove an average of 111 miles per day in 2015.