 Photo: Daniel Zeevi/Flickr
If you’ve ever had to read through some text heavy information filled with statistics, you know how easy it can be for your eyes to glaze over and begin to lose focus on what the stats are actually referring to.
Enter the infographic, which has been around for far longer than Pinterest would have you believe. Because infographics are defined as “graphic visual representations of information, data or knowledge intended to present complex information quickly and clearly,” according to Search Engine Journal, even cave paintings from 30,000 BC could easily count as the first infographics due to their depiction of data and resources in the surrounding area.
Yet in more recent years there is no doubt that infographics are a popular method to disseminate facts in a colorful, memorable way. According to a study by Hubspot in 2016, infographics are three times as likely to be liked and shared off social media than any other type of content.
Because of infographics’ viral nature and their simplifying of complex ideas, creating this sort of content can be beneficial to your brand and can help drive traffic back to your website if you have created an infographic that was either useful or intriguing. Not only do they create more brand awareness, they also improve search engine optimization (SEO) and help you connect with your target audience.
Commonly used to break down large amounts of data into understandable chunks, infographics don’t have to be limited to this one use. They can also be used as a recruiting tool showing off a snapshot of your landscaping company, explaining the operations of a complex process such as when or why plants would need fertilizer, or to present startling facts or comparisons.
Sometimes telling a client they’ll save so many gallons with a new irrigation system may not click with them but seeing an infographic showing the percentage that it fills an Olympic swimming pool may have the visual impact they needed.
In order to create a successful infographic, there are several elements that you should keep in mind.
Keep it simple
The number one purpose of an infographic is to take a complex topic and distill it into a simplified visual form. Sometimes if there are too many things going on in an infographic it can make it more confusing than the original topic. If there is too much going on, the reader can be repelled by the uninviting nature of the content.
It is better to break topics up into mini infographics than create one large one that is an information overload for your audience. Throwing together a hodge-podge of facts and stats with no overall goal will not create the content you are looking for.
Add some originality
There are a lot of template websites that allow the user to input their information and then it creates an infographic, but generally these will lack the design elements that will help it stand out from the many other infographics out there. By creating an interesting color scheme, pattern flow or title, you can help your infographic stand a head above the rest.
Use graphics
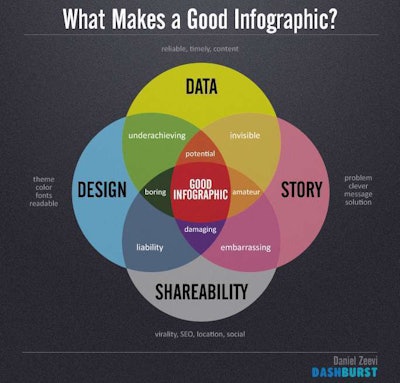
Considering it’s part of its name, remembering to include the graphics in an infographic is pretty important. Slapping a picture next to a bunch of data does not make it an infographic. A balance between graphics and information is needed to tell the story properly. Too much text will drive away potential readers. It’s better to catch their attention with a powerful visual and then hold them there with your facts.
Make it shareable
Once you’ve created your infographic, do not wait for it to suddenly become viral on a whim. You are going to have to promote the content, so you’ll need to reach out to sources that are influential in the green industry and ask that they share your infographic. You’ll also want to post it on your social media accounts and ask for followers to share it as well.
As for the actual construction of an infographic, you can turn to the professionals or use some of the great applications like Piktochart and Vectr. Vectr is a free and intuitive vector graphics editor app for web and desktop. It has a very low learning curve, making graphic design accessible to anyone.


